The USGS has evaluated Sequoia’s LISST-ABS at 10 streamflow-gaging stations, collecting LISST-ABS and suspended sediment concentration (SSC) data between January 2016 and February 2018. The evaluation also compared the LISST-ABS to standard turbidity sensors normally used by the USGS. The results are presented in this report: Manaster, A.E., Straub, T.D., Wood, M.S., Bell, J.M., Dombroski, D.E., and Curran, C.A., 2020, Field evaluation of the Sequoia Scientific LISST-ABS acoustic backscatter sediment sensor: U.S. Geological Survey Open-File Report 2020–1096, 26 p., https://doi.org/10.3133/ofr20201096.
The report finds that “Using the LISST-ABS as a surrogate for measuring SSC in a dynamic fluvial system shows promise given the results of the ABS concentration and SSC correlation coefficients at the 10 stations tested using factory-calibrated instruments.” The LISST-ABS was more sensitive than the optical turbidity sensors in sensing sand variations with depth in the water column: Correlation coefficients (Pearson’s r value) for the 10 datasets varied between 0.718 to 0.956 for the ABS vs SSC and between 0.118 to 0.984 for turbidity vs SSC. For more details, read on below. For much more details, read the pdf here.
The map below shows the 10 sampling stations, spread out across the US.
The table below shows the correlation coefficient, r, between LISST-ABS factory-calibrated concentration and SSC from water samples, and between turbidity and SSC from water samples. It is clear that the correlations are generally better for the LISST-ABS than for the turbidity sensor.

Table showing the correlation coefficient, r, between LISST-ABS concentration, turbidity and SSC from water samples for the 10 stations. From Manaster et al. 2020.
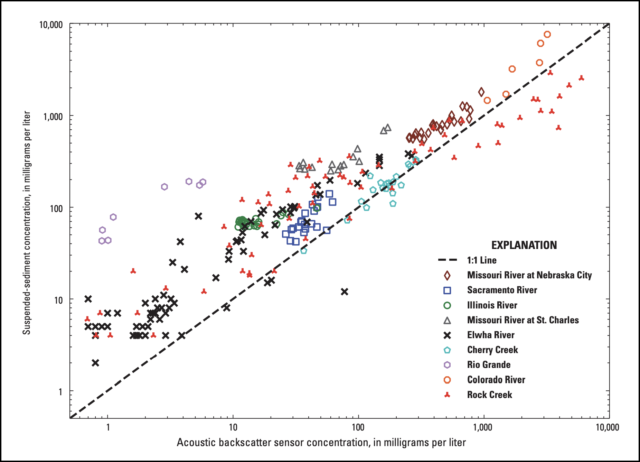
The scatterplot below shows the factory-calibrated SSC from the LISST-ABS vs SSC. Note that most of the data are around the 1:1 line, indicating that the factory calibration does a very good job of measuring SSC without any field calibrations of the LISST-ABS.

Scatterplot of all LISST-ABS factory-calibrated concentrations vs SSC from field samples. Note clustering around the 1:1 line. From Manaster et al., 2020.
But do read the entire report.
