The LISST-SL measures the Volume Distribution of particles in 32 size classes, just like any other LISST. Additionally, it measures the temperature, depth, and current velocity. Consequently, it is straightforward to plot profiles of the size distribution, mean size (or any other size parameter that can be computed from the size distribution, e.g. the median size), and total concentration. In addition, by multiplying the velocity with the concentration, one can obtain the sediment flux for 32 size classes. The figures below show some example plot from a profile in the Cowlitz River, WA, USA in March 2011. Data courtesy of Chris Curran and Raegan Huffman, Washington Water Science Center, USGS Tacoma, WA.
The first figure shows the velocity profile (note that units are in ft and ft/s; this can be changed at will on the LISST-SL topside control box). Close to the bottom the velocity varies significantly, due to eddies spinning off the bottom.
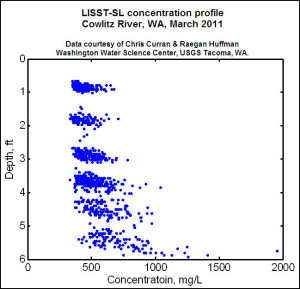
The second figure shows the concentration profile. The LISST-SL measures the volume concentration of the suspended sediment, but by assuming a sediment density the volume concentration can be converted to mass concentration, as in this plot, created by assuming a density of 2.65 g/cm3. Note the large variability of concentration at a given depth; this variability is due to turbulent eddies being advected past the instrument and will be completely missed with a depth-integrating sampler or with a point sampler.
The third figure shows the variation in mean particle size down the profile. The mean size increases from around 15 µm at the surface to 40-50 µm at the bottom. Note also the large variability in mean size at any given depth, due to turbulent eddies passing by the LISST-SL.
This plot shows the variability in the size distribution in the profile. A ‘ridge’ appears around 30-40 µm, where the concentration is constant down through the profile. For the larger particles, larger than ~150 µm, the concentration is relativley low in the surface 2 feet, then increases towards the bottom.
The last figure shows the sediment flux in 2 size fractions, smaller and larger than 63 µm. The blue line shows the flux of the < 63 µm particles. Although the concentration of these particles is constant through the profile, the flux of small particles is decreasing towards the bottom, because the velocity is decreasing. The reverse is true for the > 63 µm particles. Their concentration is strongly increasing towards the bottom, so the flux of particles > 63 µm is increasing closer to the bed, even if the velocity is decreasing. At the bottom the total sediment flux is split almost 50/50 between the fine and coarse particles, whereas at the surface the total sediment flux is completely dominated by the fine (< 63 µm) particles.


