Updated 29 April, 2016
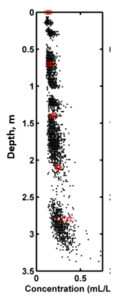
The loss of accuracy, i.e. error in concentration can be  caused by a number of factors. Overall, the accuracy of LISST instruments is demonstrated by this vertical profile taken in a river by USGS scientists. The black points are LISST data, and the few red circles are samples taken by USGS using P-61 samplers. We explain the various noise sources below in roughly increasing order of importance.
Also, see in an accompanying article that turbidity missed all the details of concentration variability in this profile that the LISST revealed, click here. Also see paper by Agrawal and Hanes, Water Resources Res. (2015) at our Library.
Electronic noise – the electronic noise in the output of LISST detectors is less than one digital count. Consequently, the impact on concentration estimates is well below 1micro-l/l.
Bad or inappropriate Backgrounds – Each measurement must be taken with a good Background, preferably acquired immediately before the measurement. If the Background is not matched to the data (due to ageing, fouling of windows, misalignment), the resulting size distribution will have errors. Particularly serious errors arise if the alignment changes since acquiring the Background. In this case, the errors arise in the large size end of the size distribution. Change in cleanliness of the window will lead to errors in the middle part of the size distribution. In case of significant misalignment, the data may be rendered useless. It is very important to collect a proper background immediately before data collection. Our version 5.1 software (download from this website) guides a user in determining the quality of the background, with a Pass/Fail recommendation.
Extreme deviation in Particle Shape – Sequoia provides matrices for inverting the light scattering data into an equivalent sphere distribution, or into ‘randomly shaped’ terrigenous sediment grains. These grains are an ISO standard from powders (popularly known as AC spark plug dusts). These particles do not have preferred axes. However, when measuring particles with long axes (quartz) or others like mica (which are flat plates), the concentration and even size can have errors. For these extreme shape cases, we recommend a paper by Felix et al.(2013), see our Library.
Fluctuations in Concentration, Insufficient Averaging – Concentration fluctuations are everywhere – in the laboratory and in nature. The concentration fluctuations are more extreme for larger grains than for smaller grains (mostly because of their relative abundance). So, when trying to get a mean concentration, it is important to pay attention to the standard deviation of the fluctuations and the time-scale of these fluctuations. For example, in the small mixing chamber of the instrument, the time-scale of fluctuations is typically no longer than about 1/4 second. The standard deviation of the concentration for coarse grains, s, can be as large as 10% or even more. If you want accuracy e=1%, you must average over (s/e)-squared number of time-scales,i.e. in this example, for 100 time-scales, or 25 seconds.
Fluctuations of concentrations in nature can have a wide range of time scales, from seconds to hours and even longer. Averaging strategies here are more complex, depending on the desired informaton – short term average of global. The key reminder is to recognize that averaging should be done over number of appropriate integral time scales.
Bias due to Poor Mixing and Vertical Gradients – By far, this is the least well understood factor in our users. It shows up when people attempt to calibrate an instrument with coarse grains.
Sediment concentration always varies in the vertical direction, whether in nature or in a mixing chamber in the lab. This is because gravity is constantly pulling particles down, and if there is some stirring or turbulence, it is trying to mix them, lifting them up by diffusion. The balance creates a vertical gradient. The gradients are stronger for larger particles (with stronger settling velocity), and smaller for small particles. The greatest source of error in laboratory work arises from the existence of these gradients in the small mixing chambers. How to check – start slow, keep increasing stirring. If concentration reaches a constant value, good enough.
Presence of Particles Outside the Measurement Range: When a sample contains particles that are either too small or too large, some of these are aliased in. If particles that are too small are present, this produces a rising tail at the small particle sizes. The same happens at the large particle end if too large particles are present. This is explained here.
Copyright Sequoia Scientific, Inc. 2016