| Application | Typical wavelengths for application | LISST-Tau Wavelength (nm) | Item No. |
|---|---|---|---|
| Light penetration studies | 420 nm – 450 nm (clearest open ocean waters; shifts to ~ 470 nm - 490 nm where CDOM is present) | ~470 nm (Blue) | SEQ-FP-LTAU-470NM |
| Visibility studies | 507 nm – 555 nm (peak human eye sensitivity, night-day) | ~532 nm (Green) | SEQ-FP-LTAU-532NM |
| Particulate concentration | ~660 nm | ~640 nm (Red) | SEQ-FP-LTAU-650NM |
You are about to buy a LISST-Tau. It has several wavelength options (light color). How do you choose which one to order? The wavelength choice depends on the application. Light of different wavelengths experiences different in-water attenuation. In the open ocean, water absorbs red light most and blue light least (see figure). Blue light is mostly what scatters back to our eyes, so clear water looks blue. Near shore, CDOM strongly absorbs blue and UV light. This shifts the water’s color toward green. Each wavelength interacts differently with water, particles and dissolved matter. So the wavelength of your transmissometer determines what your measurement means — which is what the rest of this page is about.
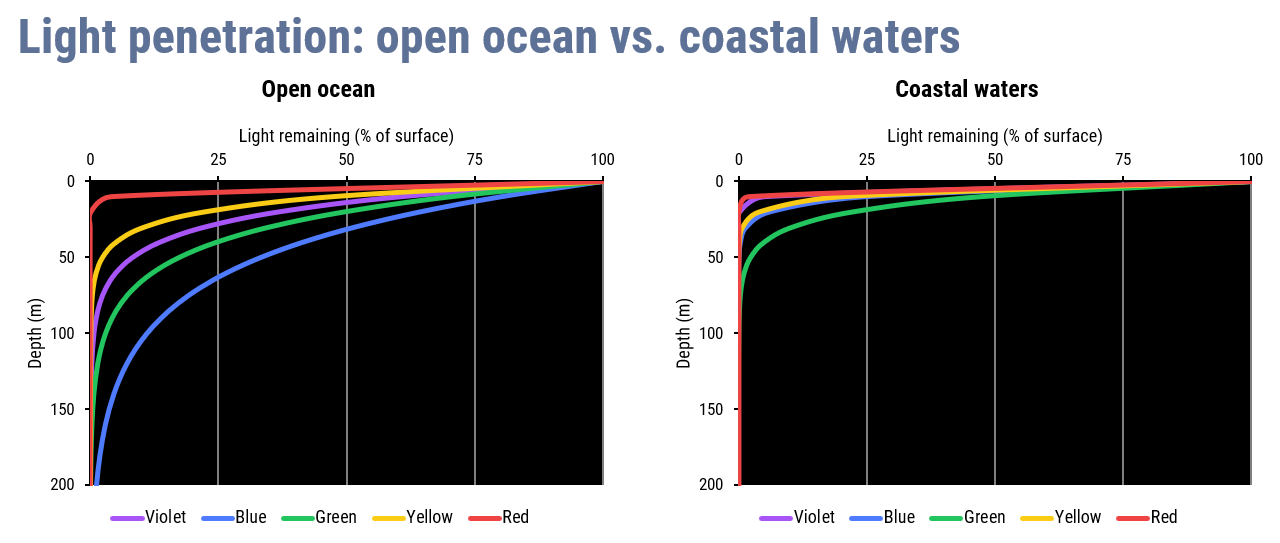
Illustrative model (exponential attenuation by colour); not measured data.
Red light fades within tens of metres; blue penetrates deepest in clear open ocean water.
Green penetrates deepest in coastal water due to CDOM absorption in the blue.
When should I choose a blue LISST-Tau transmissometer?
Transmissometers with blue wavelengths, typically around 460 nm – 470 nm are most often used for applications where it is important to understand some form of maximum light penetration depth. This is because blue wavelengths are the last wavelengths to be absorbed by water. They therefore penetrate the deepest in the water. Beam attenuation of blue light therefore gives you an idea of how deep light can potentially reach. Blue light, however, is strongly absorbed by CDOM, so in coastal waters the above does not hold. Consider green instead, as green light is less absorbed by CDOM (see figure above). Finally, note that light transmission in the blue also has implications for how much light is available for photosynthesis.
When should I choose a green LISST-Tau transmissometer?
Transmissometers with green wavelengths, typically around 520 nm – 535 nm are most often used for various types of underwater visibility studies. The reason is as follows: In daylight conditions, the human eye has peak sensitivity at ~ 555 nm, but at nighttime the peak sensitivity shifts to ~ 507 nm. In many naval, scientific and commercial applications it is important to have an idea of the underwater visibility. For example, if a diver or a camera system or a remotely operated vehicle (ROV) or a 3D laser scanning survey system is about to be deployed. For those applications, a green transmissometer with a peak wavelength somewhere between 507 nm and 555 nm is best as it is close to the human-eye peak sensitivity wavelengths. It can therefore be used to estimate the visibility prior to deployment: visibility scales roughly with the inverse of the beam attenuation. A green transmissometer could also be useful in matchups with green lidar measurements.
When should I choose a red LISST-Tau transmissometer?
Transmissometers with red wavelengths, typically close to ~650 nm are most often used for various particle dynamics studies. There are both pragmatic as well as scientific reasons for this. First the pragmatic reason: Historically, red LEDs were easier to find and better suited for low-power applications than other LEDs. Consequently, early transmissometers mostly used red LEDs. If you are trying to compare to or extend existing time series, a red LISST-Tau would therefore be the most logical choice. The scientific reason is that CDOM absorbs weakly around ~650 nm. Most of the contribution to non-water attenuation in the red comes from particulate scattering. This enables you to establish a relationship between beam attenuation and particulate concentration. (Note that the validity of this relationship still assumes a non-changing particle size distribution). For this reason, if your main purpose is to use the transmissometer to estimate particle concentration, you should choose a red transmissometer.

LISST-Tau
Why should I have to choose at all?
You shouldn’t! This is why Sequoia is currently (2025-2027) developing a hyper-spectral transmissometer called Hyper-c. The development of the Hyper-c is funded by NASA‘s SBIR program. We anticipate that we will start issuing quotes for the Hyper-c in Q4/2027 or Q1/2028 with the first deliveries in Q2/2028.
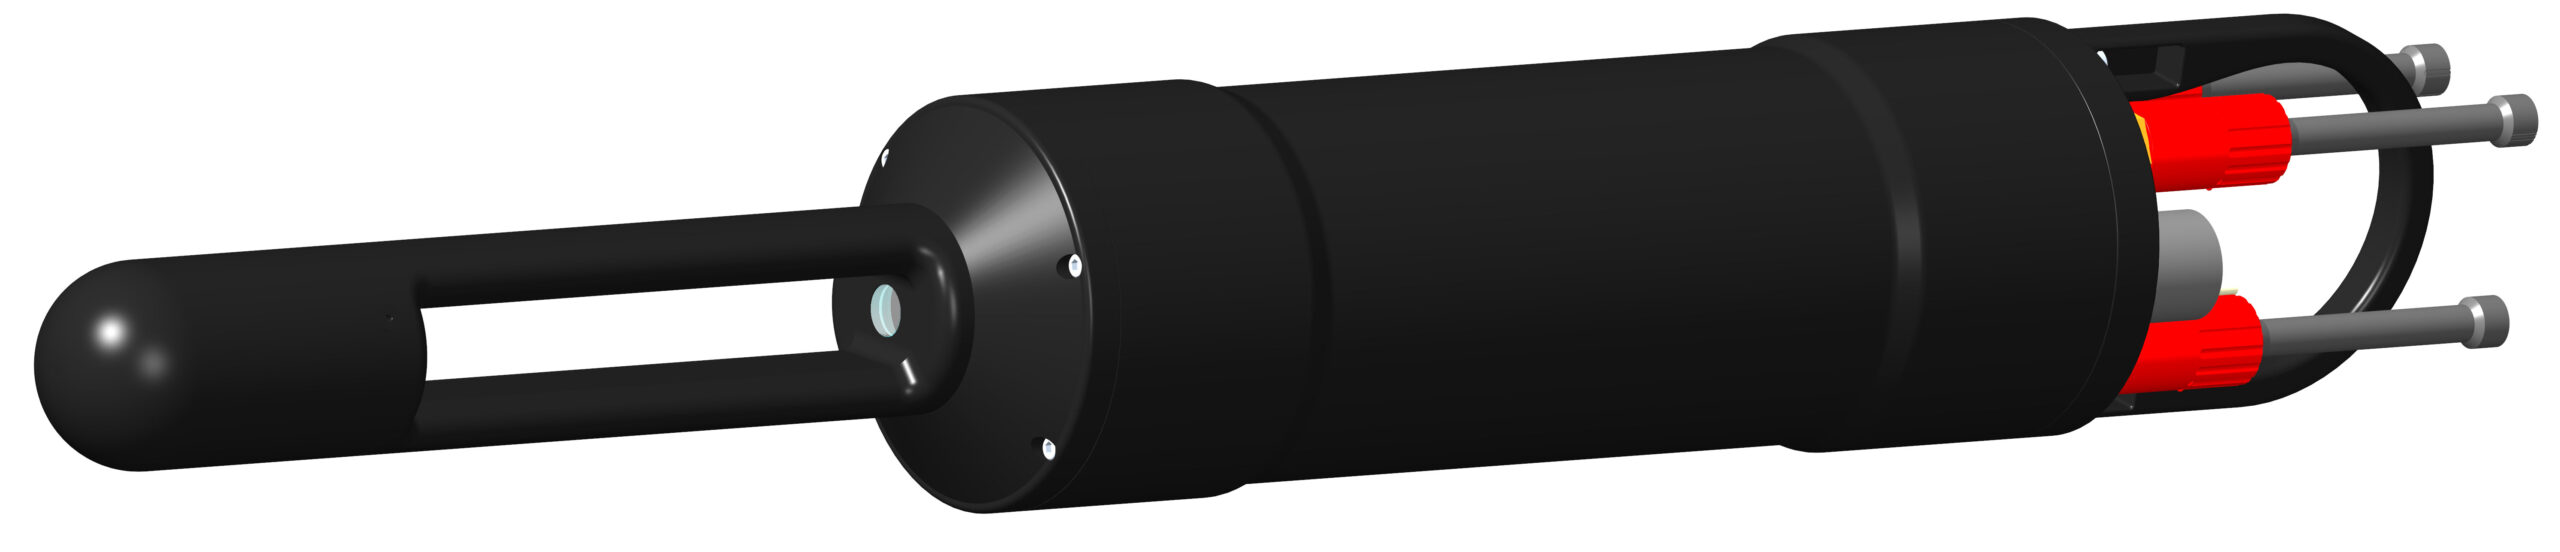
Mockup of submersible hyperspectral transmissometer (Hyper-c) under development.
What does the output spectra of Sequoia’s LISST-Tau’s look like?
We’re glad you asked! Here is a figure showing the output spectrum for the blue, green and red LISST-Tau (cf. item numbers in the table on top of the page).
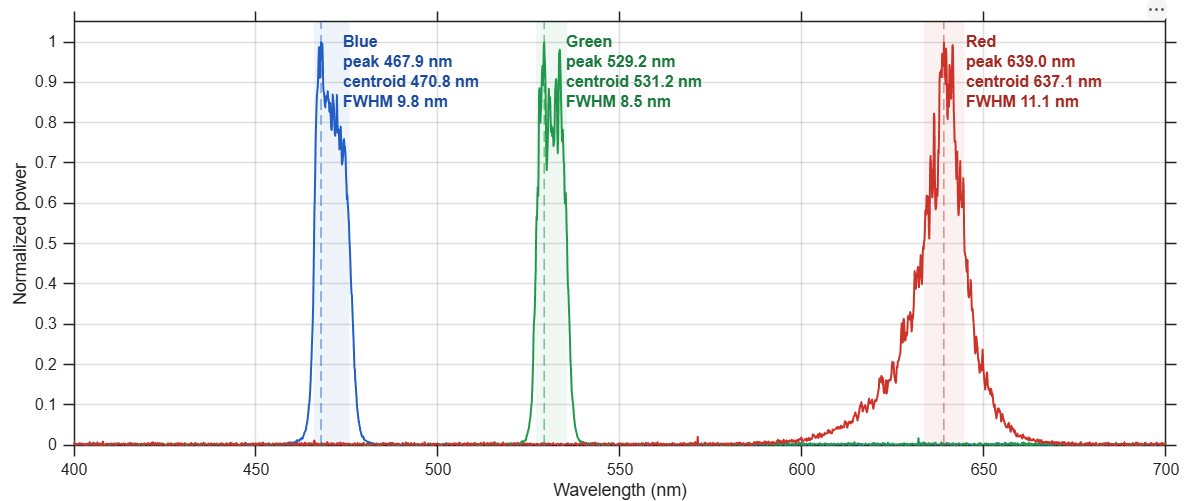
LISST-Tau output spectra
Read more:
- Behrenfeld, Boss (2006): Beam attenuation and chlorophyll concentration as alternative optical indices of phytoplankton biomass. Journal of Marine Research, 64, 431–451, 2006. doi:10.1357/002224006778189563