This page is written to explain how to interpret your data files.
File formats and contents of processed datafiles are described here (note, the page numbers may differ by Manual versions):
- For LISST-100X User’s Manual, see Appendix A, page 117 [pages before 117 contain other numerical data, e.g. particle size classes, angles at which scattering is measured …
- LISST-200X User’s Manual, see Appendix C, page 101….
Processing the raw data files (*.dat, or *.log) in LISST-100X or LISST-200X result in, respectively, .ASC and .csv files. Refer the manual for details.
COMMON MISPERCEPTION
The outputs in Volume Distribution cells are not ‘concentrations in rings’; instead they represent concentration in size classes 1 – 32 (or 1 – 36 for LISST-200X).
Your processed files are ready for converting to plots. Here are suggestions. [A MATLAB function will be offered for reading the ASCII output file into variables. Pl check our website. It will output a structure variable, with obvious names.]
VIEWING YOUR DATA
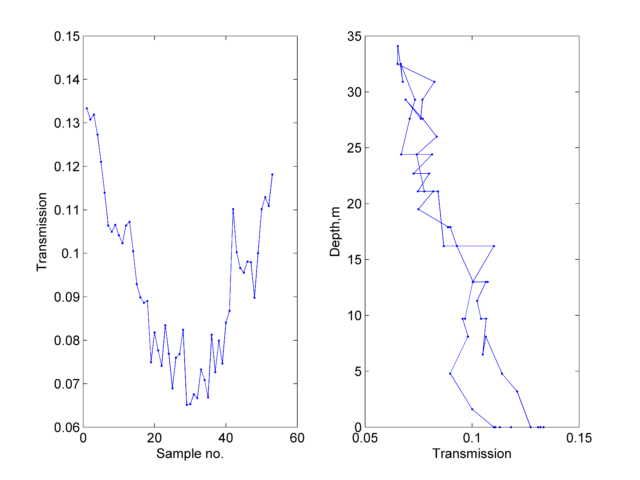
Transmission: The very first plot worth making is that of optical transmission. The optical transmission is not a measure of particle concentration. It serves two purposes: (i) is the transmission within specified range of the instrument; and (ii) in a crude sense, the transmission is an approximate indicator of particle concentration. A plot of transmission vs sample number or vs time can help get an overview. When a depth profile is involved, plotting the transmission against depth is highly valuable. This can indicate if particle concentration (again crudely) is increasing with depth, as in rivers and shallow estuaries, etc.
Particle Size Distribution (PSD): The size distribution is a 2-dimensional array. If there are 100 samples, and N size classes (N=32 for 100X, N=36 for 200X, and N=44 for |Portable |XR ), then the particle size distribution would be a 100 x N data array. You can plot all or a part of the PSD against sample number, or against time variable. For those who use Matlab, the pcolor command is a handy way to see all the PSD’s. For example, these commands were used to make the plots below:
 subplot(121),set(gca,’linewidth’,[3],’fontsize’,[12]),pcolor(vd(1:end,1:32)’),shading(‘interp’),xlabel(‘Sample no.’),ylabel(‘Size Class’)
shows the time sequence of PSD’s. Here you can readily spot ‘events’ in time.
When depth profiles are involved, you can view the profile of PDS’s with depth, using this command:
subplot(122), set(gca,’linewidth’,[3],’fontsize’,[12]),pcolor(data(1:end-1,37)/10,dias32c_np,vd(1:end-1,1:32)’),shading(‘interp’)
Such profiles reveal vertical structure in the particle size distribution. An example is shown here. It is a profile from a river, showing a growing coarse particle mode with depth.
Total Particle Concentration: Simply summing the PSD’s give the total concentration. Again, this can be plotted against time as a sequence, or as a profile against depth.
Separating Total Concentration into Washload and Suspended Load: If you have obtained PSD’s, you can sum parts of it to separate one from the other. For example, for LISST-100X (TypeC), washload is the first 21 bins <64), and 22 to 32 adds up to suspended load (>64microns).
COMMON FAULTS IN DATA
BACKGROUNDS: Prior to release of Version 5.1 software for LISST-100X, the user was required to make a subjective judgment on whether to accept or reject a newly acquired background. Only qualitative guidance was provided, such as if the background was too high compared to factory or ….In version 5.1 the pass/fail criterion was automated (if you have not already done so, you can download it at our website). Bad backgrounds – i.e. contaminated by dirty windows, temperature fluctuations in water used for it, dirty water, bubbles etc. can degrade the background. The result is a reduction of operating range. Version 5.1 eliminates this problem. If you don’t use Version 5.1, you should begin right away. The newer model, LISST-200X automatically performs this function and gives feedback to the operator on pass/fail or what to do.
FAULTY DATA
The biggest single cause of bad data is unsuitable backgrounds – taken too long ago, or contaminated with dirt on windows etc. This is a very serious issue if you are working in clear waters such as coasts or open ocean waters. Extreme care is required. Here is guidance on other indications.
MISALIGNMENT: Misalignment would be indicated while collecting background file. If the misalignment occurs due to a bump after collecting the background, it can be found by repeating the background. In cases of mild misalignment, continue operation after storing a new background. If the misalignment is severe, data quality would be degraded. Contact the factory. In some cases, Sequoia can help recover meaningful results even so. Contact us.
OPTICAL TRANSMISSION: Check the optical transmission. If below 30% the particle size distribution (PSD) may show a rising tail at the small size end of PSD. This originates from multiple scattering, and may not be real. In most cases, simply discard the smallest size bins. Note, particles below measurement range of instruments can produce this tail even when transmission is well above 30%. If transmission > 99%, your PSD will be noisy as there is not sufficient scattered energy on the detectors in the instrument.
PARTICLE SIZE DISTRIBUTION: [LISST-100X only] If your PSD shows a rising tail, and water depth is low, the scattering seen by ring detectors may be contaminated by ambient light, thus inventing fine particles. This problem does not exist in the LISST-200X; it is programmed to reject ambient light. Second, if the PSD has a spike at a single size, it is almost certainly an error; such spikes cannot arise from measured light scattering.
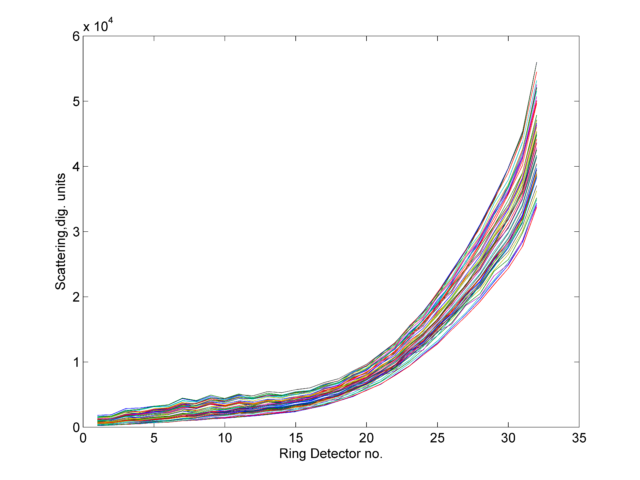 NET SCATTERING ON RINGS: The most rigorous test of data quality, done only at the factory, is to test for smoothness of the net light on rings. Users who employ our Matlab software for data processing can view this property. Smooth net scattering can only arise from high quality data. The test is visual, so a little subjective. A saw-tooth pattern on net scattering can result from occasional fibrous material in the laser beam. In general, if data are saved as average of many samples, the sawtooth structure is minimal. Figure below shows many scans of high quality net particle scattering data.
Created 30 May 2017